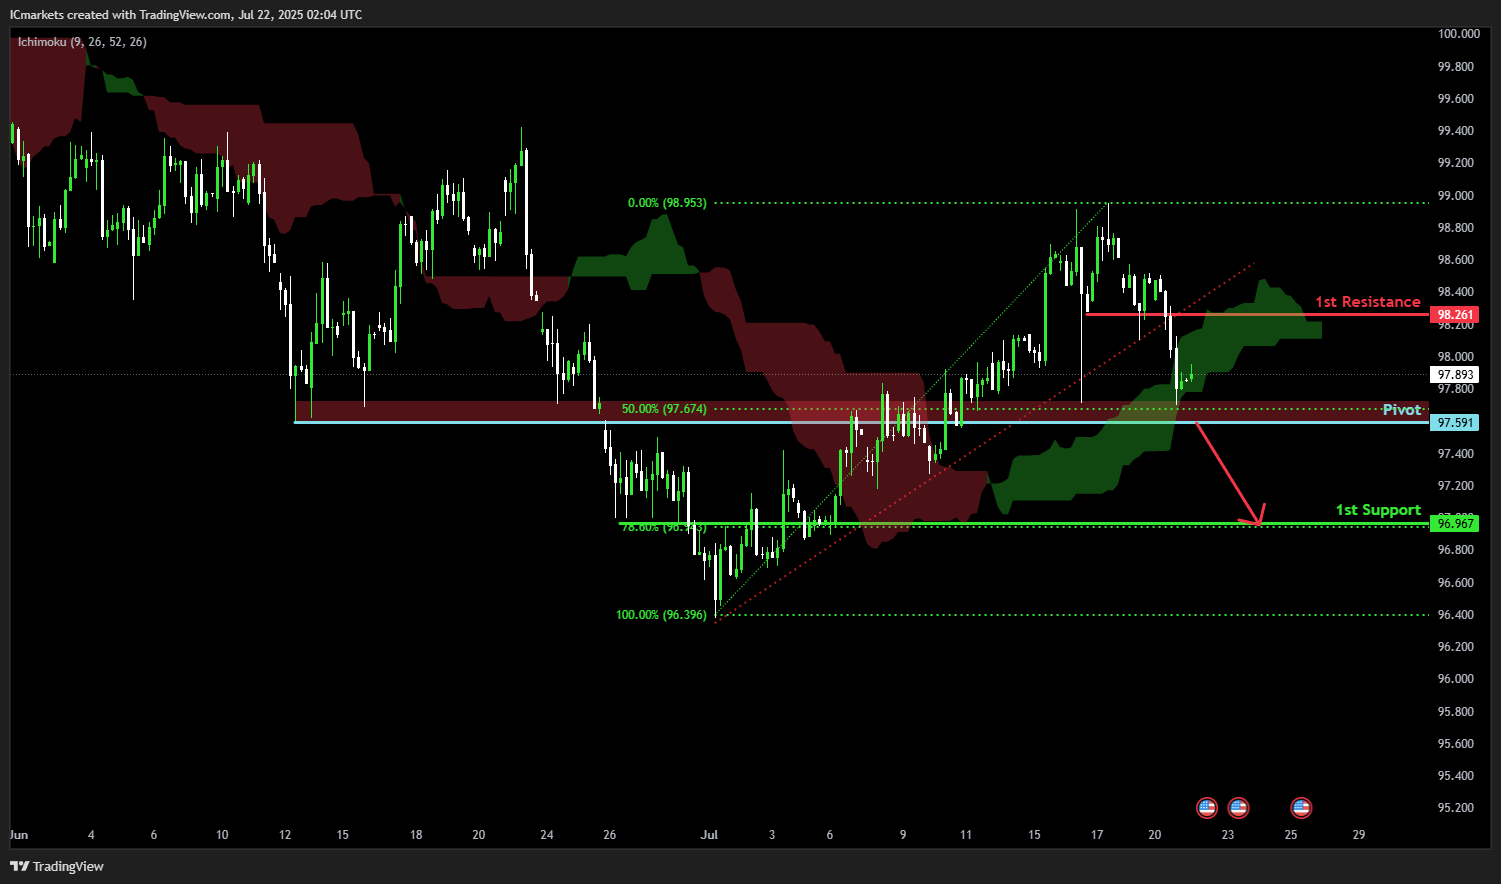
DXY (U.S. Dollar Index):
Potential Direction: Bearish
Overall momentum of the chart: Bullish
Price has broken an ascending support line and shows increased bearish momentum. If it breaks below the key pivot support, especially with the Ichimoku Cloud support just above this level, a further bearish decline could be triggered toward the 1st support.
Pivot: 97.60
Supporting reasons: Identified as a crucial pivot support level, coinciding with the lower edge of the Ichimoku Cloud. A clear break below this zone may accelerate selling pressure.
1st support: 96.96
Supporting reasons: Functions as a potential overlap support, where past price action suggests the market could stabilize before making another major move.
1st resistance: 98.26
Supporting reasons: Identified as a pullback resistance, representing a possible level where upward movements could be capped if the price fails to break below support and instead rebounds.
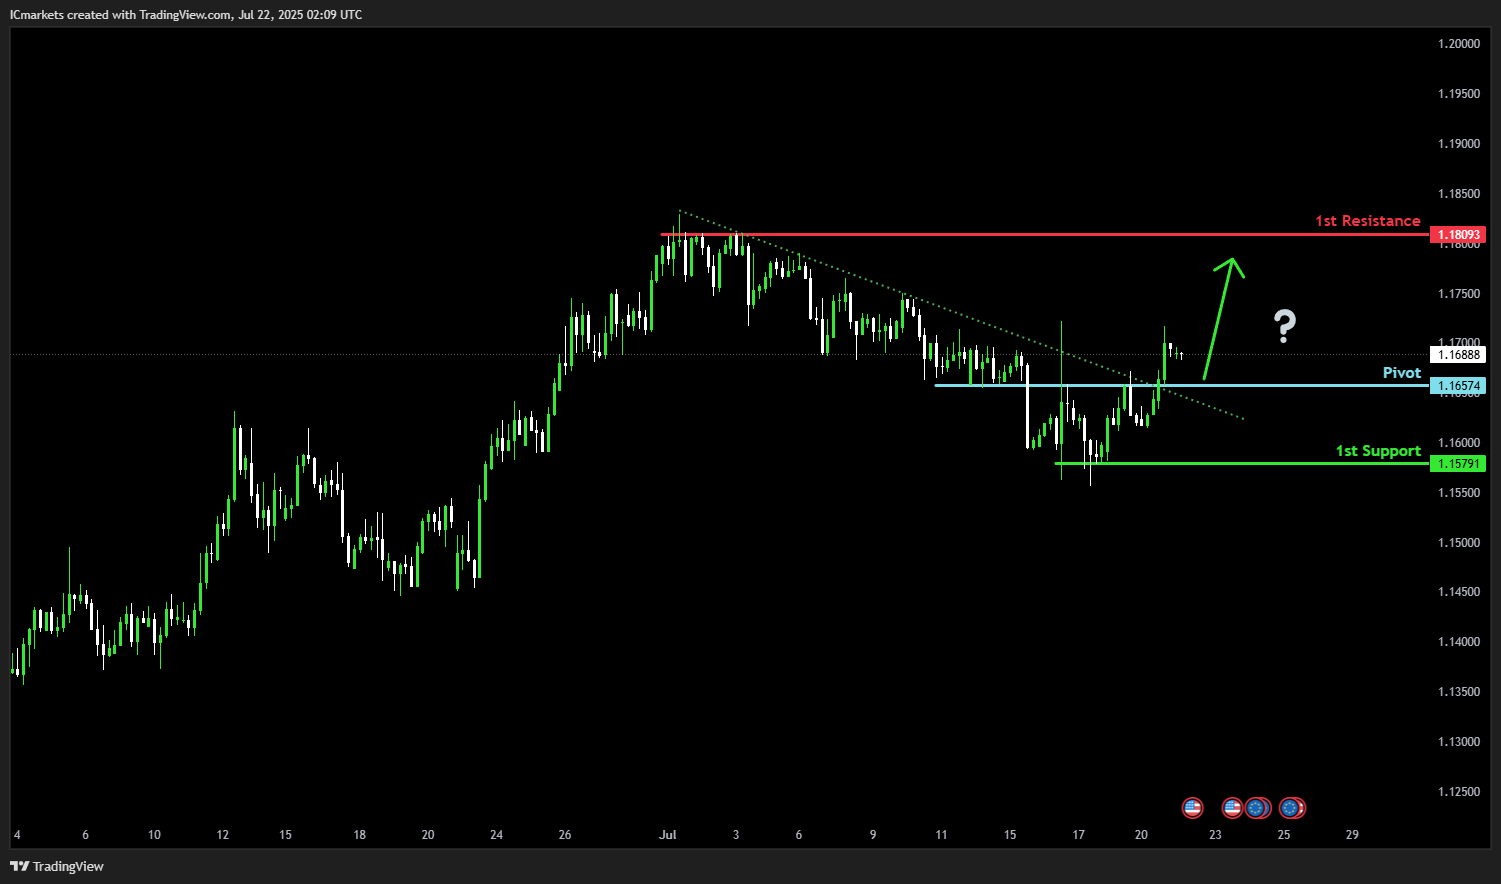
EUR/USD:
Potential Direction: Bullish
Overall momentum of the chart: Bullish
The price could potentially make a bullish bounce off the pivot and rise toward the 1st resistance.
Pivot: 1.1657
Supporting reasons: Identified as an overlap support that aligns with the 61.8% Fibonacci retracement, indicating a potential area where buying interests could pick up to resume the uptrend.
1st support: 1.1579
Supporting reasons: Identified as an overlap support that aligns with the 50% Fibonacci retracement, indicating a potential area where the price could again stabilize.
1st resistance: 1.1809
Supporting reasons: Identified as a swing high resistance, indicating a potential area that could halt any further upward movement.
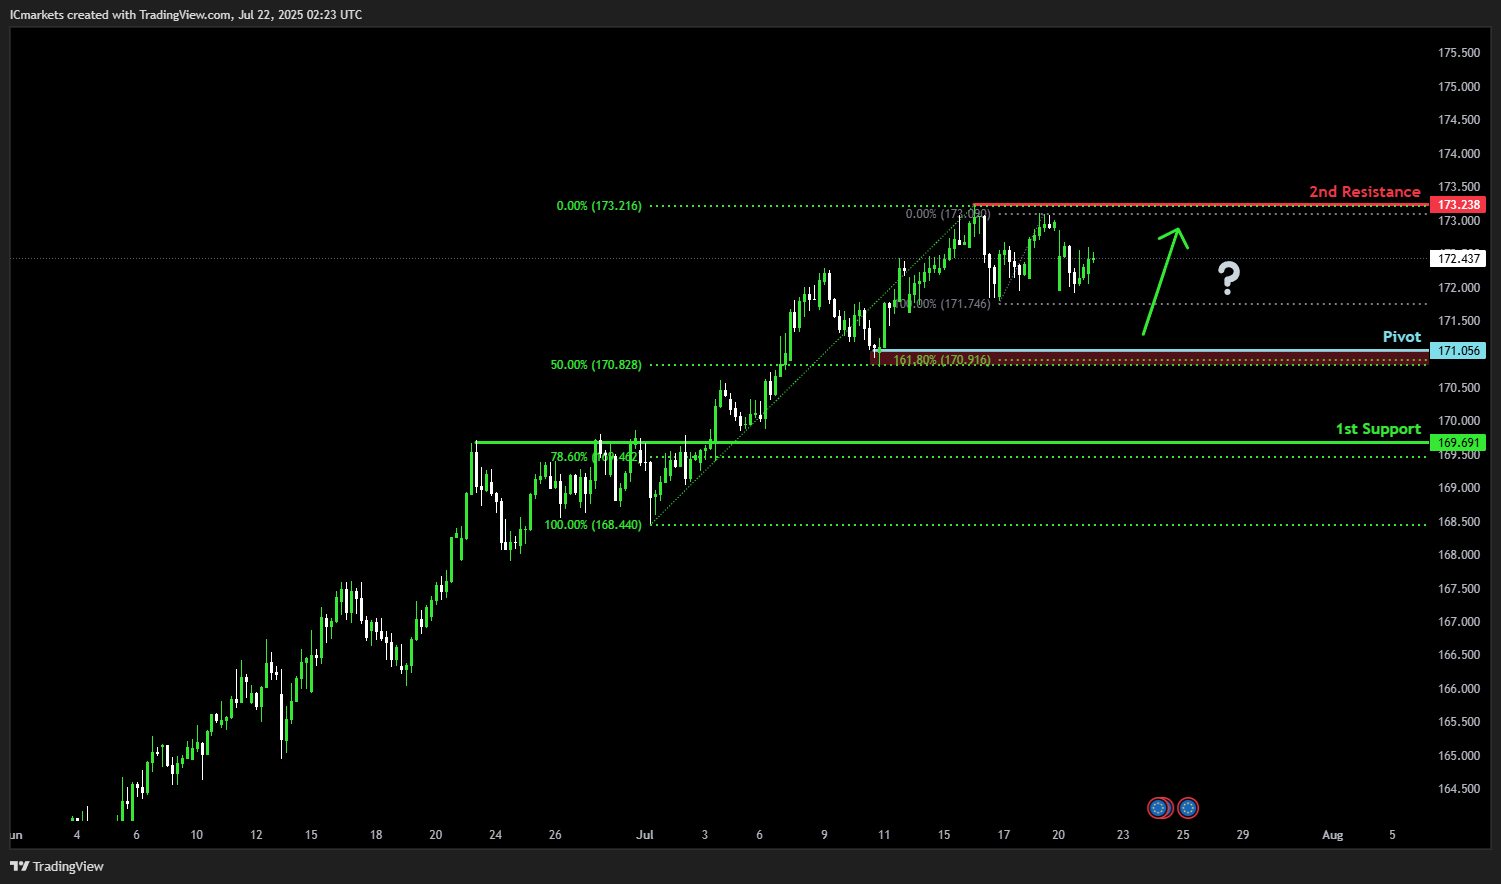
EUR/JPY:
Potential Direction: Bullish
Overall momentum of the chart: Bullish
The price could fall toward the pivot and make a bullish bounce off the pivot and rise toward the 1st resistance.
Pivot: 171..05
Supporting reasons: Identified as a pullback support slightly below the 23.6% Fibonacci retracement, indicating a potential area where buying interest could pick up to resume the uptrend.
1st support: 169.69
Supporting reasons: Identified as a pullback support that aligns with the 138.2% Fibonacci extension, this area could potentially serve as a level where the price may stabilize again.
1st resistance: 173.23
Supporting reasons: Identified as a swing-high resistance, acting as a key area that could halt any further upward movement.
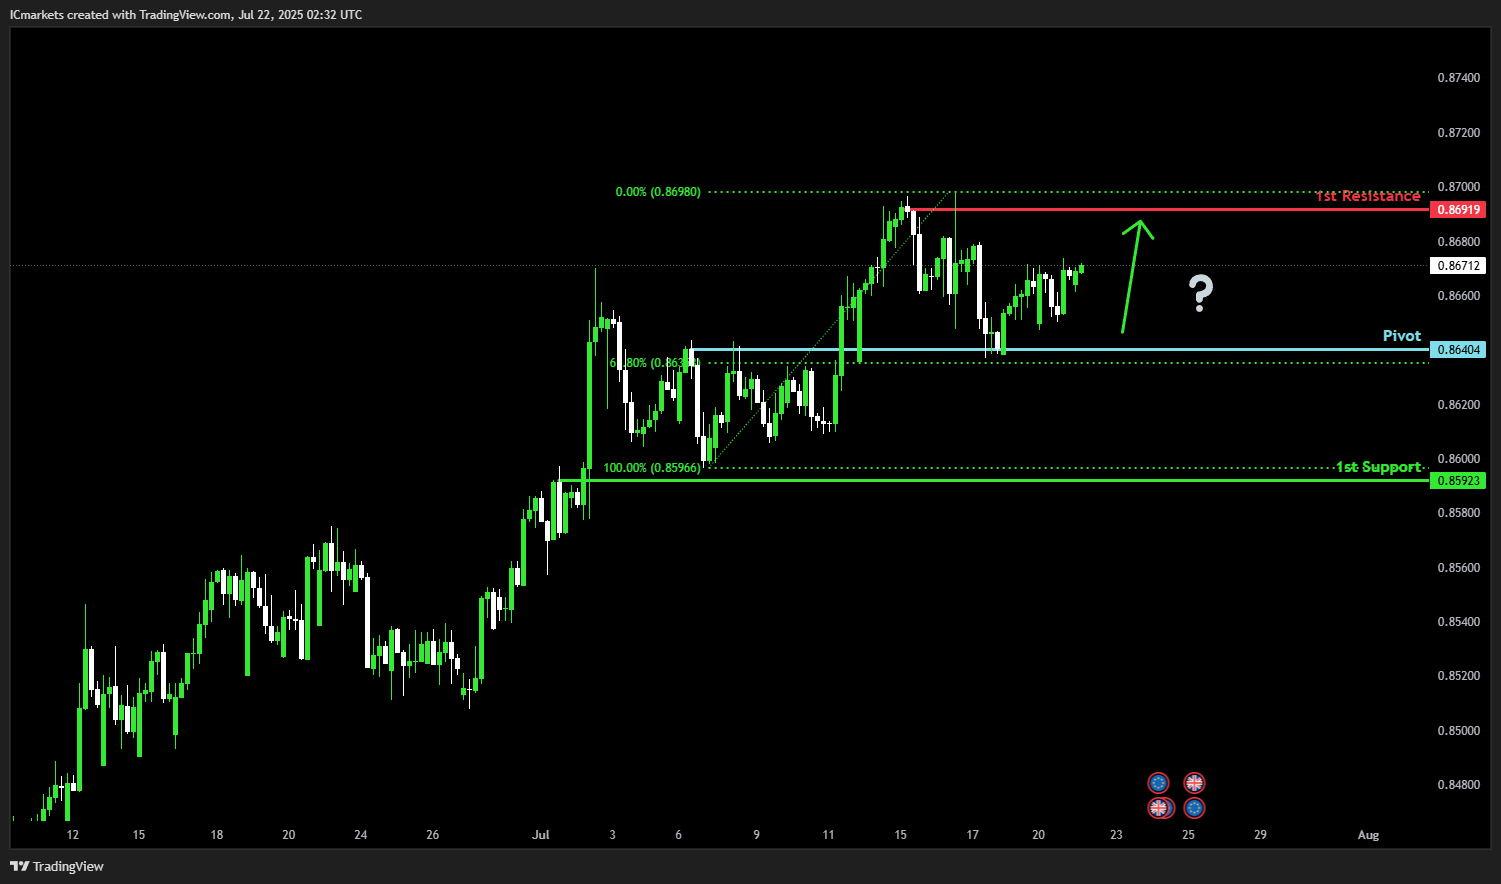
EUR/GBP:
Potential Direction: Bullish
Overall momentum of the chart: Bullish
The price could fall toward the pivot and make a bullish bounce off the pivot and rise toward the 1st resistance.
Pivot: 0.8640
Supporting reasons: Identified as a pullback support that aligns closely with the 61.8% Fibonacci retracement, indicating a potential area where buying interest could pick up to resume the uptrend.
1st support: 0.8592
Supporting reasons: Identified as a pullback support, indicating a potential area where the price could stabilize once more.
1st resistance: 0.8691
Supporting reasons: Identified as a swing-high resistance, acting as a key area that could halt any further upward movement.
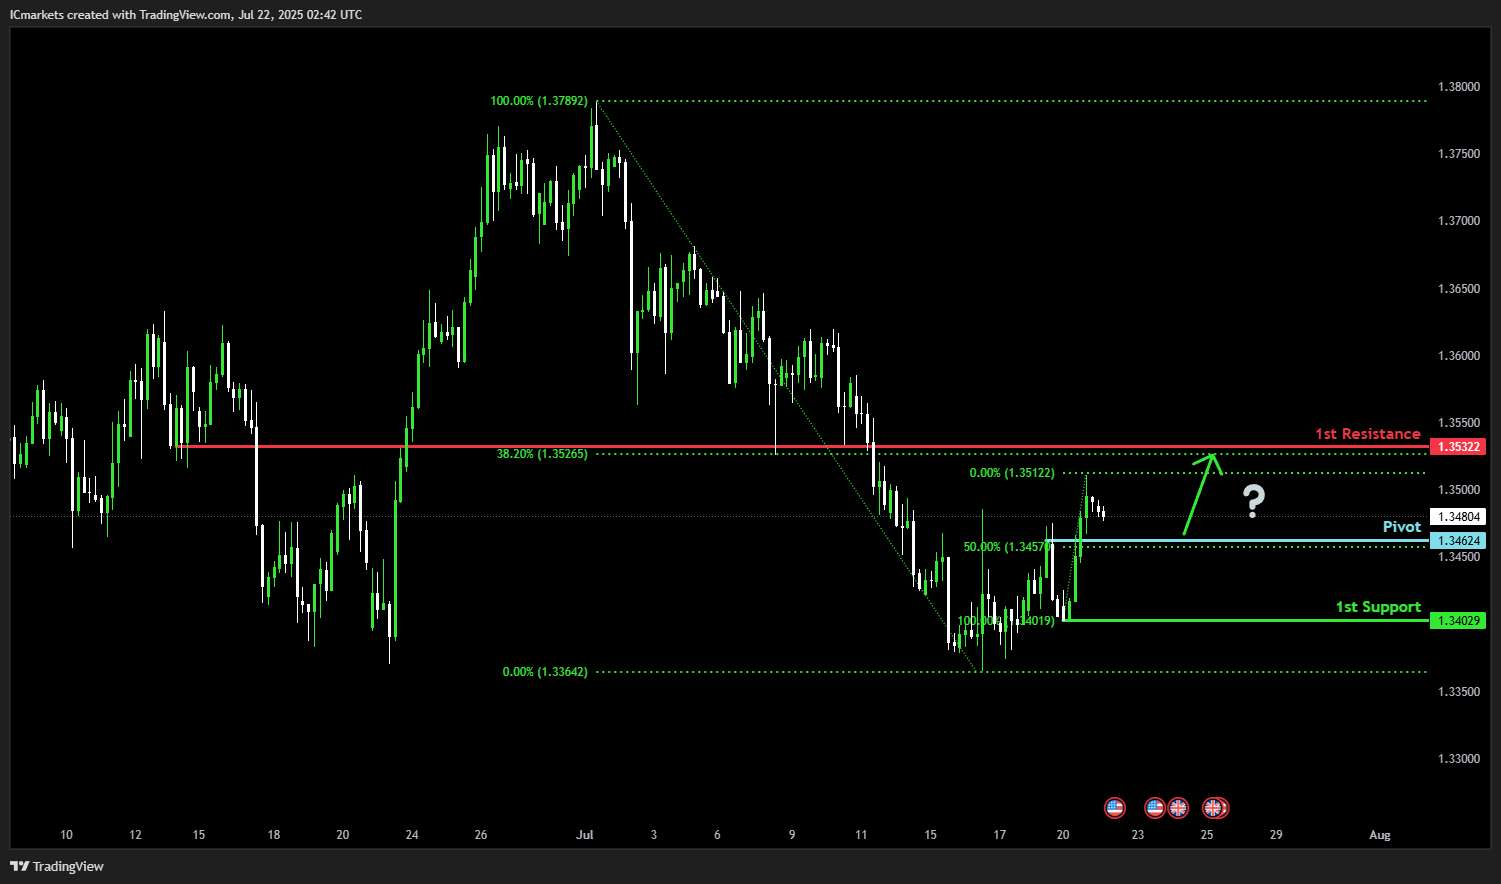
GBP/USD:
Potential Direction: Bullish
Overall momentum of the chart: Bullish
The price could make a bullish bounce off the pivot and rise toward the 1st resistance. Additionally, the price is above the Ichimoku Cloud, which adds further significance to the strength of the bullish momentum.
Pivot: 1.3459
Supporting reasons: Identified as an overlap support that aligns closely with the 50% Fibonacci retracement, indicating a potential area where buying interest could pick up to resume the uptrend.
1st support: 1.3402
Supporting reasons: Identified as a pullback support, indicating a potential area where the price could stabilize once more.
1st resistance: 1.3542
Supporting reasons: Identified as a pullback resistance level aligning with the 71% Fibonacci retracement, this area could potentially cap further upward movement.
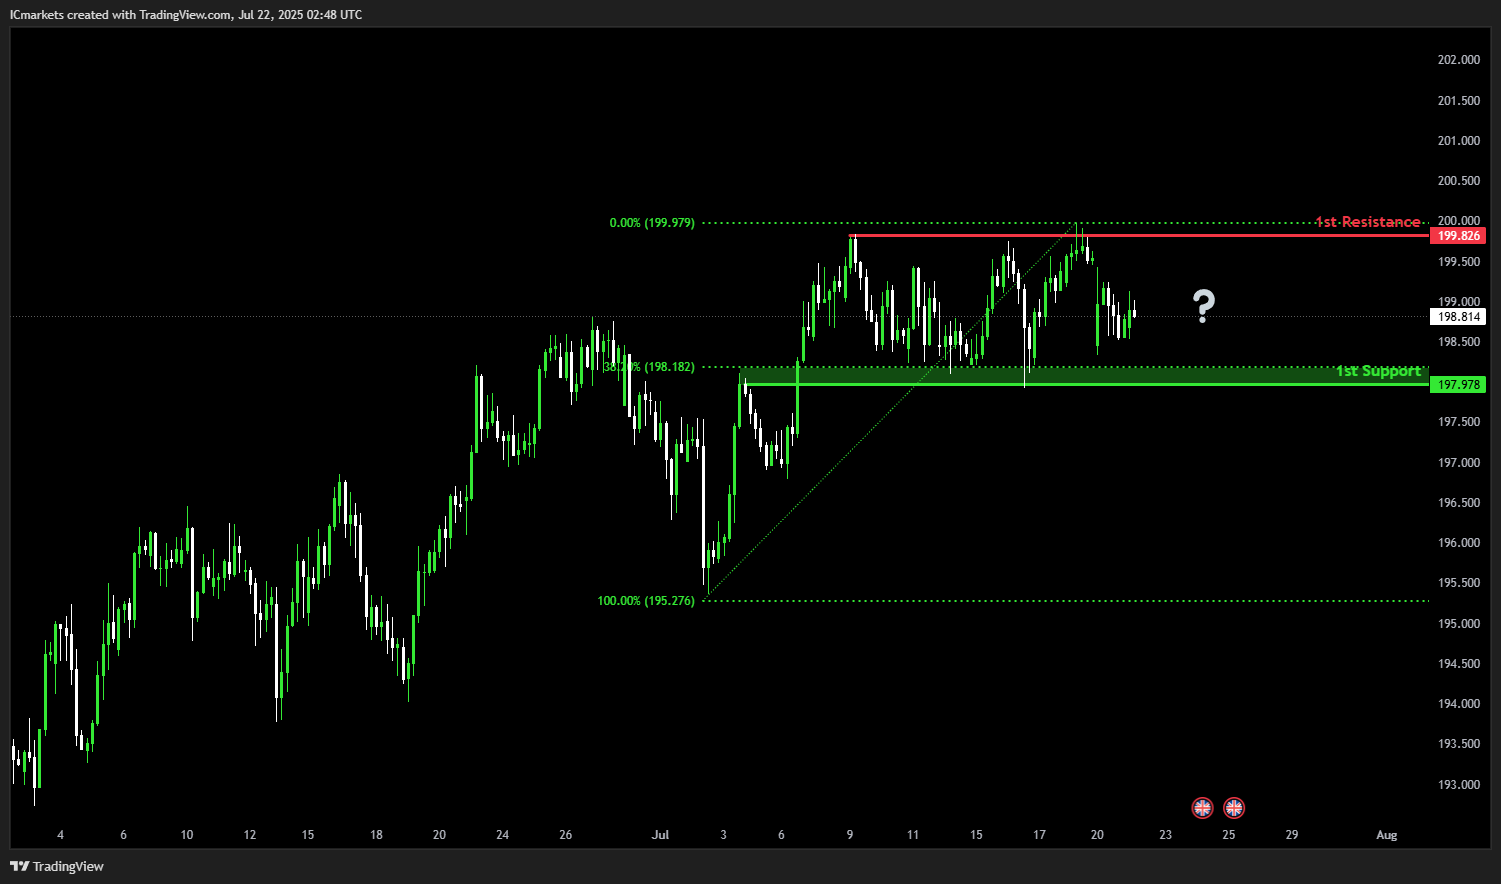
GBP/JPY:
Potential Direction: Neutral
Overall momentum of the chart: Bullish
The price is currently exhibiting a neutral momentum, with price action forecasted to fluctuate between the main support and resistance levels. This creates a tactical trading range with clear pivots and reference points for potential reversals or breakouts
1st support: 197.97
Supporting reasons: Identified as an overlap support that aligns closely with the 38.2% Fibonacci retracement, indicating a potential area where the price could stabilize once again.
1st resistance: 199.82
Supporting reasons: Identified as a swing high resistance, acting as a key area that could halt any further upward movement.
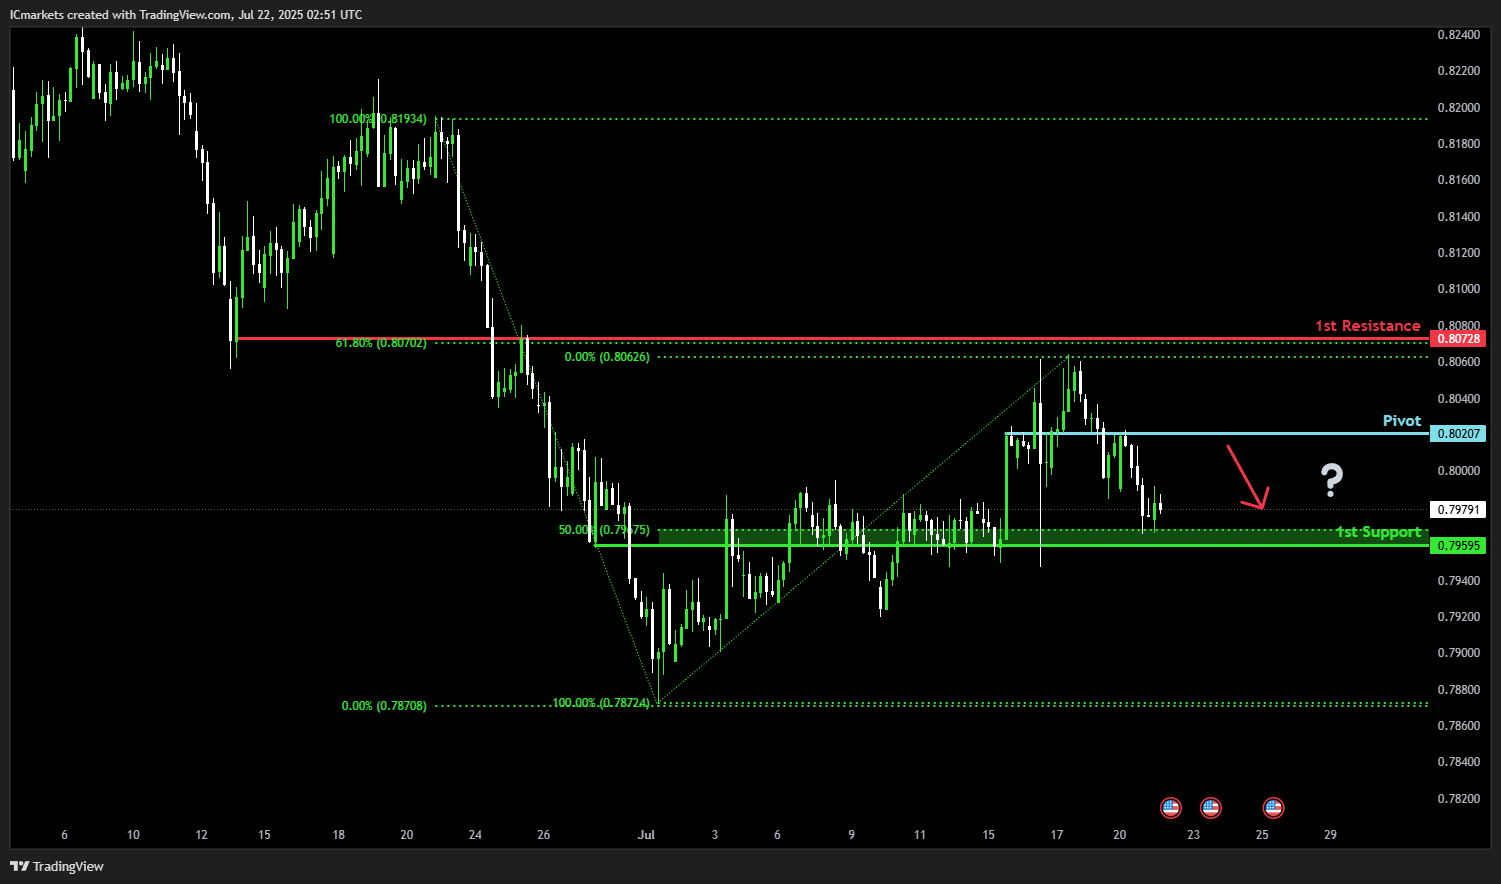
USD/CHF:
Potential Direction: Bearish
Overall momentum of the chart: Bearish
The price could make a bearish reversal off the pivot and fall toward the 1st support.
Pivot: 0.8021
Supporting reasons: Identified as a pullback resistance. This area could indicate a potential zone where selling pressure may intensify.
1st support: 0.7959
Supporting reasons: Identified as an overlap support that aligns with the 50% Fibonacci retracement, indicating a potential level where the price could stabilize once again.
1st resistance: 0.8072
Supporting reasons: Identified as an overlap resistance, acting as a key area that could halt any further upward movement.
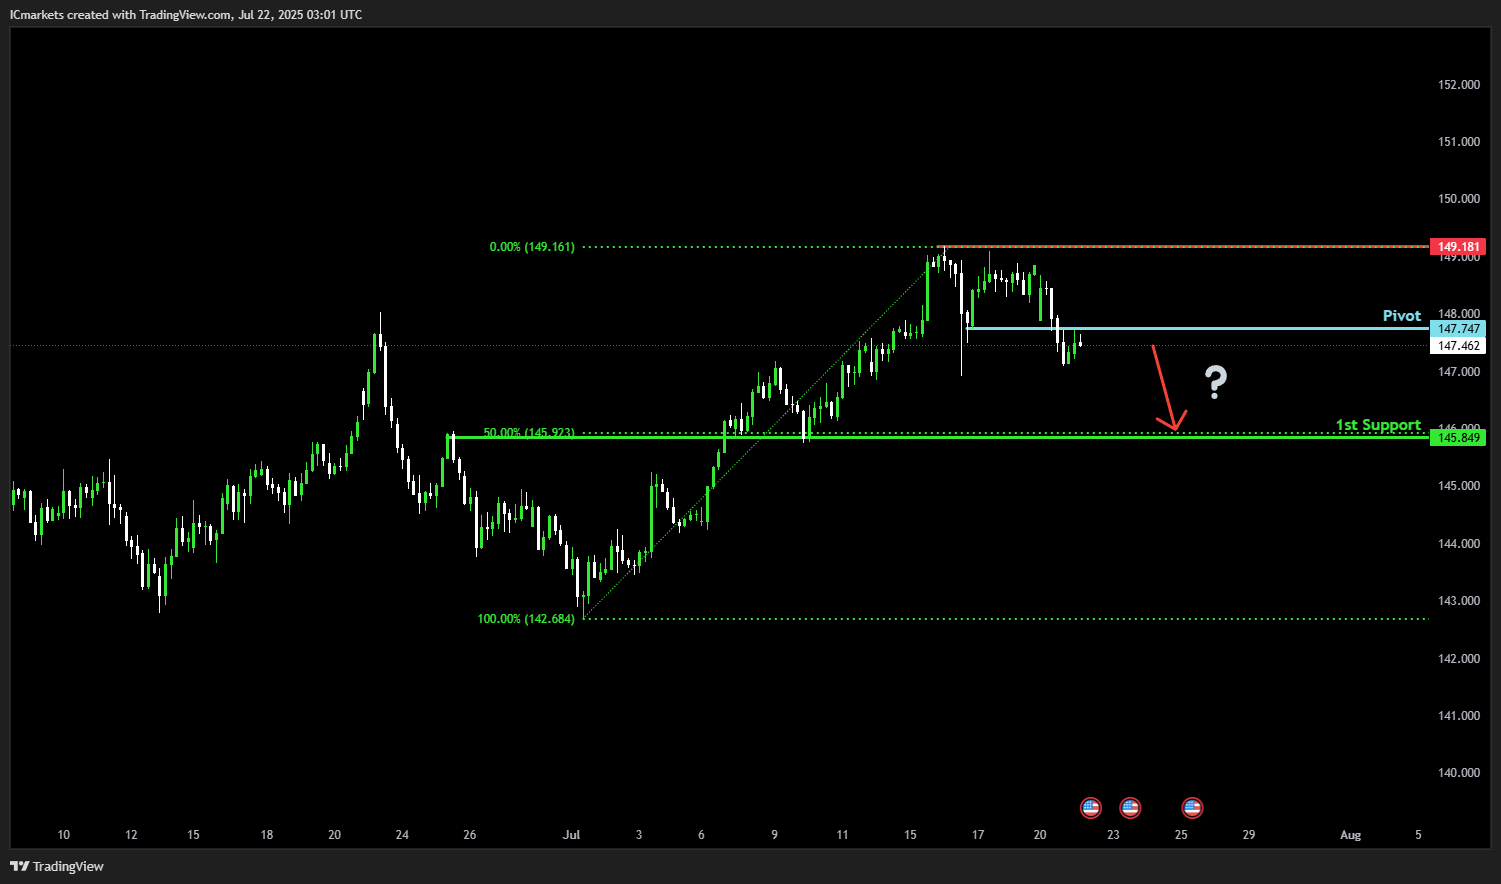
USD/JPY:
Potential Direction: Bearish
Overall momentum of the chart: Bearish
The price could make a bearish reversal off the pivot and fall toward the 1st support level.
Pivot: 147.74
Supporting reasons: Identified as a pullback resistance. This area could indicate a potential zone where selling pressure may intensify.
1st support: 145.84
Supporting reasons: Identified as an overlap support that aligns with the 50% Fibonacci retracement, this suggests a potential area where the price could stabilize once again.
1st resistance: 149.18
Supporting reasons: Identified as a swing high resistance. This area could potentially cap further upward movement.
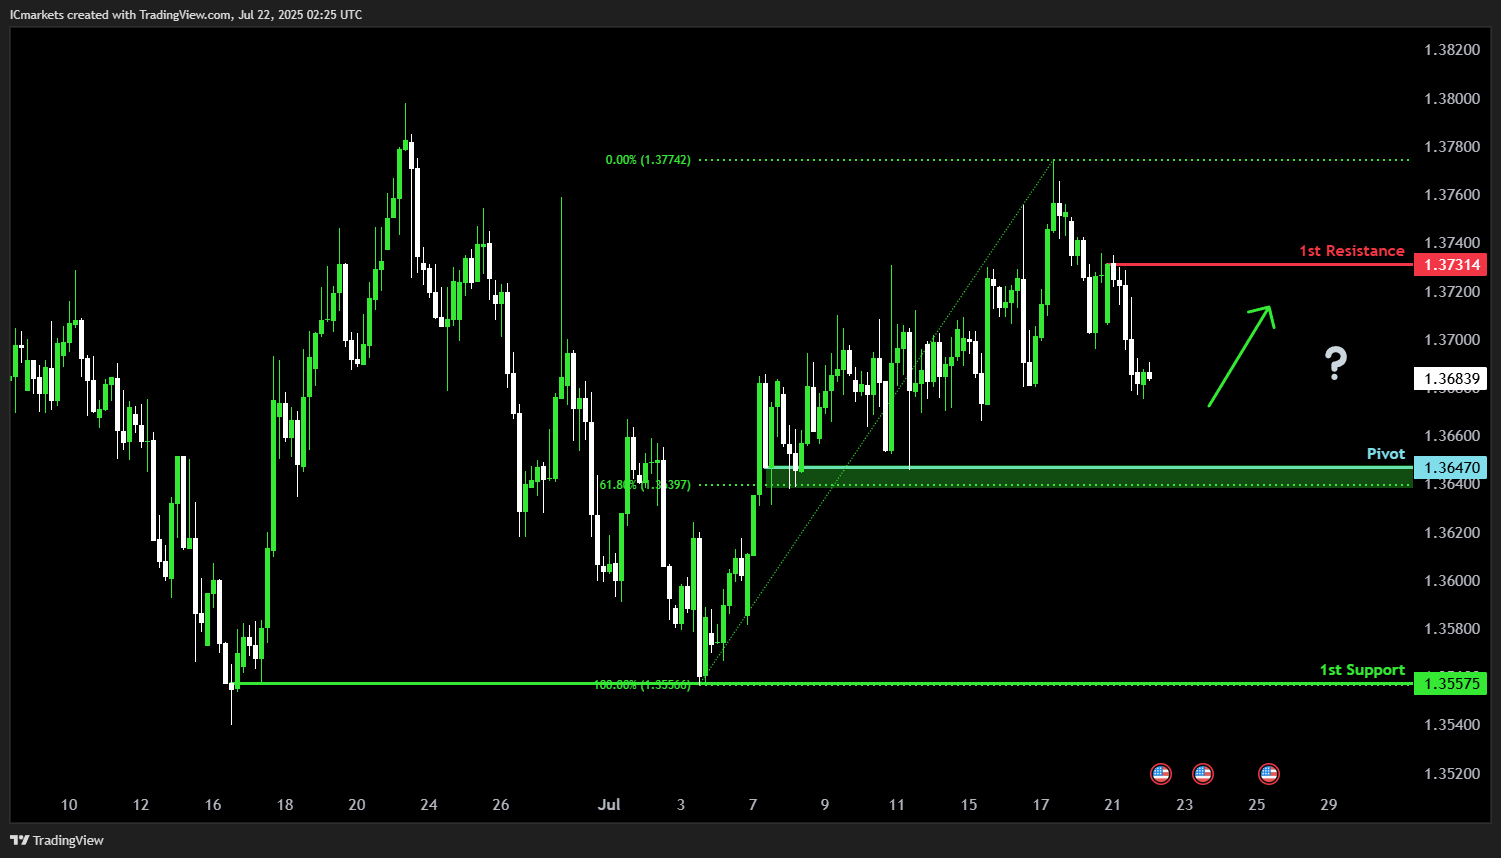
USD/CAD:
Potential Direction: Bullish
Overall momentum of the chart: Neutral
The price could fall toward the pivot and potentially make a bullish bounce off this level to rise toward the 1st resistance.
Pivot: 1.3647
Supporting reasons: Identified as a multi-swing-low support that aligns closely with a 61.8% Fibonacci retracement, indicating a potential area where buying interests could pick up to stage a rebound.
1st support: 1.3557
Supporting reasons: Identified as a multi-swing-low support, suggesting a potential area where the price could stabilize again.
1st resistance: 1.3731
Supporting reasons: Identified as a swing-high resistance, indicating a potential area that could halt any further upward movement.
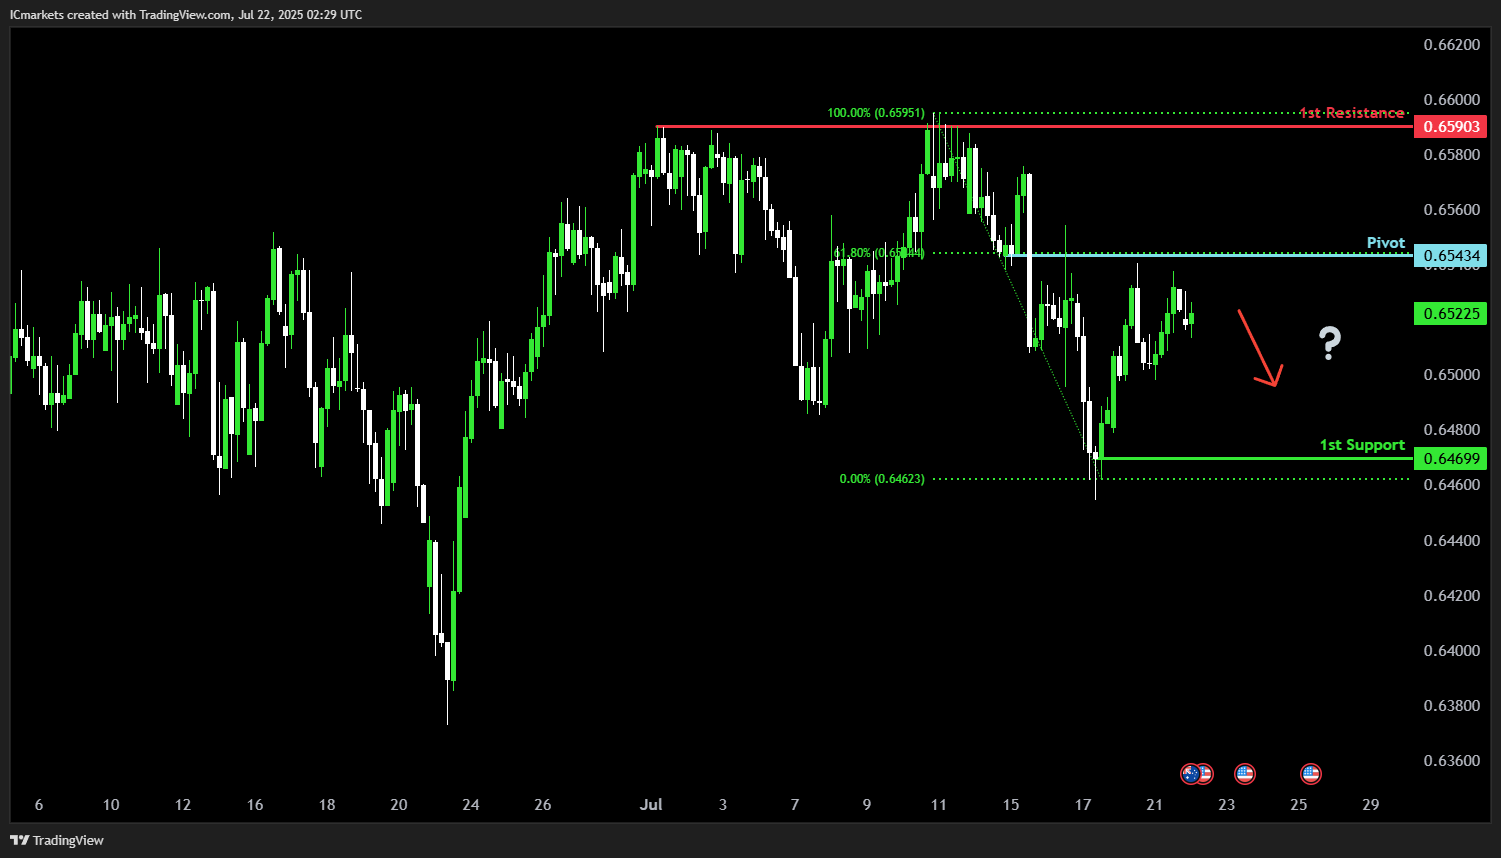
AUD/USD:
Potential Direction: Bearish
Overall momentum of the chart: Neutral
The price could rise toward the pivot and potentially make a bearish reversal from this level, leading to a drop toward the 1st support.
Pivot: 0.6543
Supporting reasons: Identified as a pullback resistance that aligns with a 61.8% Fibonacci retracement, indicating a potential area where selling pressures could intensify.
1st support: 0.6469
Supporting reasons: Identified as a swing-low support, suggesting a potential area where the price could stabilize again.
1st resistance: 0.6590
Supporting reasons: Identified as a multi-swing-high resistance, indicating a potential area that could halt any further upward movement.
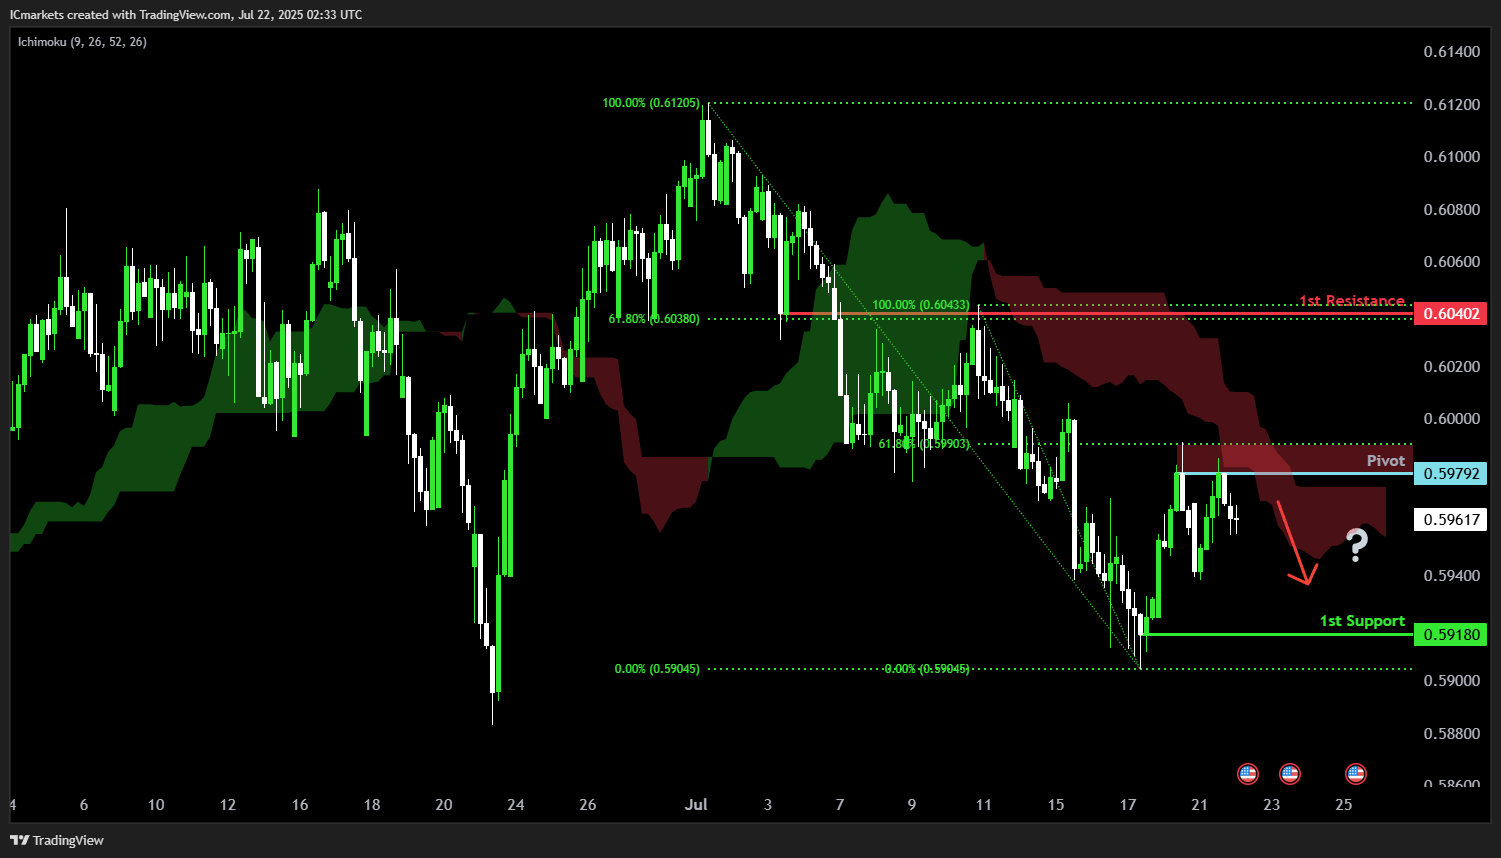
NZD/USD
Potential Direction: Bearish
Overall momentum of the chart: Bearish
The price has made a bearish reversal off the pivot and could potentially fall toward the 1st support. The presence of the red Ichimoku Cloud adds further significance to the strength of the downward momentum.
Pivot: 0.5979
Supporting reasons: Identified as a swing-high resistance that aligns closely with a 61.8% Fibonacci retracement, indicating a potential area where selling pressures could intensify.
1st support: 0.5918
Supporting reasons: Identified as a swing-low support, suggesting a potential area where the price could stabilize again.
1st resistance: 0.6040
Supporting reasons: Identified as an overlap resistance that aligns with a 61.8% Fibonacci retracement, this area could potentially halt further upward movement.
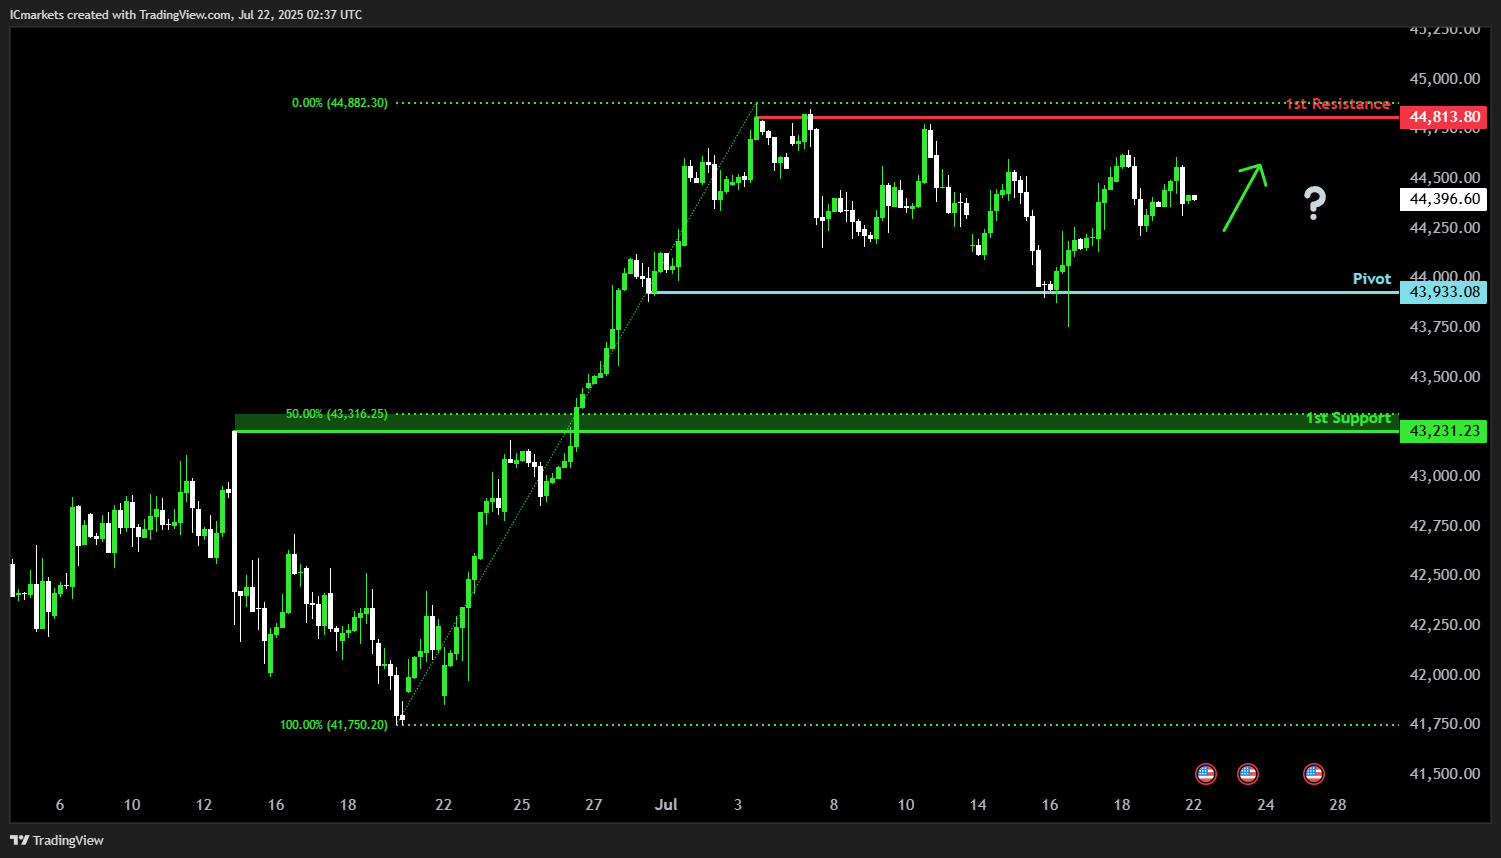
US30 (DJIA):
Potential Direction: Bullish
Overall momentum of the chart: Neutral
The price could fall towards the pivot and potentially bounce off this level to rise toward the 1st resistance.
Pivot: 43,933.08
Supporting reasons: Identified as a swing-low support, indicating a potential area where buying interests could pick up to stage a rebound.
1st support: 43,2231.23
Supporting reasons: Identified as a pullback support that aligns closely with a 50% Fibonacci retracement, suggesting a potential area where the price could stabilize once again.
1st resistance: 44,813.80
Supporting reasons: Identified as a multi-swing-high resistance that aligns close to the all-time high, indicating a potential area that could halt any further upward movement.
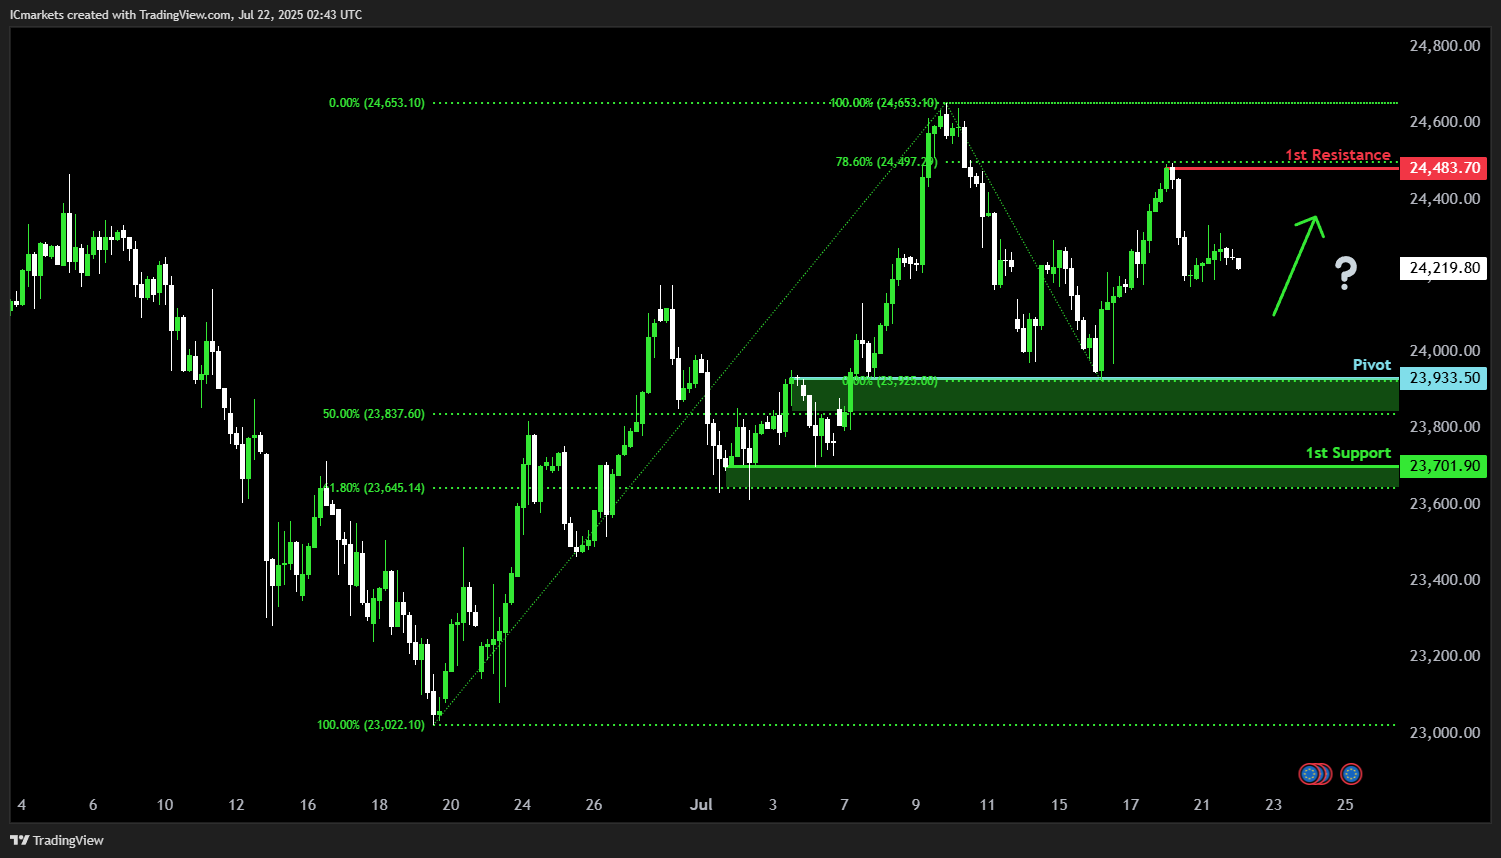
DE40 (DAX):
Potential Direction: Bullish
Overall momentum of the chart: Neutral
The price could fall toward the pivot and potentially make a bullish bounce off this level to rise toward the 1st resistance.
Pivot: 23,933.50
Supporting reasons: Identified as an overlap support that aligns closely with a 50% Fibonacci retracement, indicating a potential area where buying interests could pick up to stage a rebound.
1st support: 23,701.90
Supporting reasons: Identified as a multi-swing-low support that aligns closely with a 61.8% Fibonacci retracement, indicating a key level where the price could stabilize once more.
1st resistance: 24,483.70
Supporting reasons: Identified as a swing-high resistance that aligns with a 78.6% Fibonacci retracement, indicating a potential area that could halt any further upward movement.
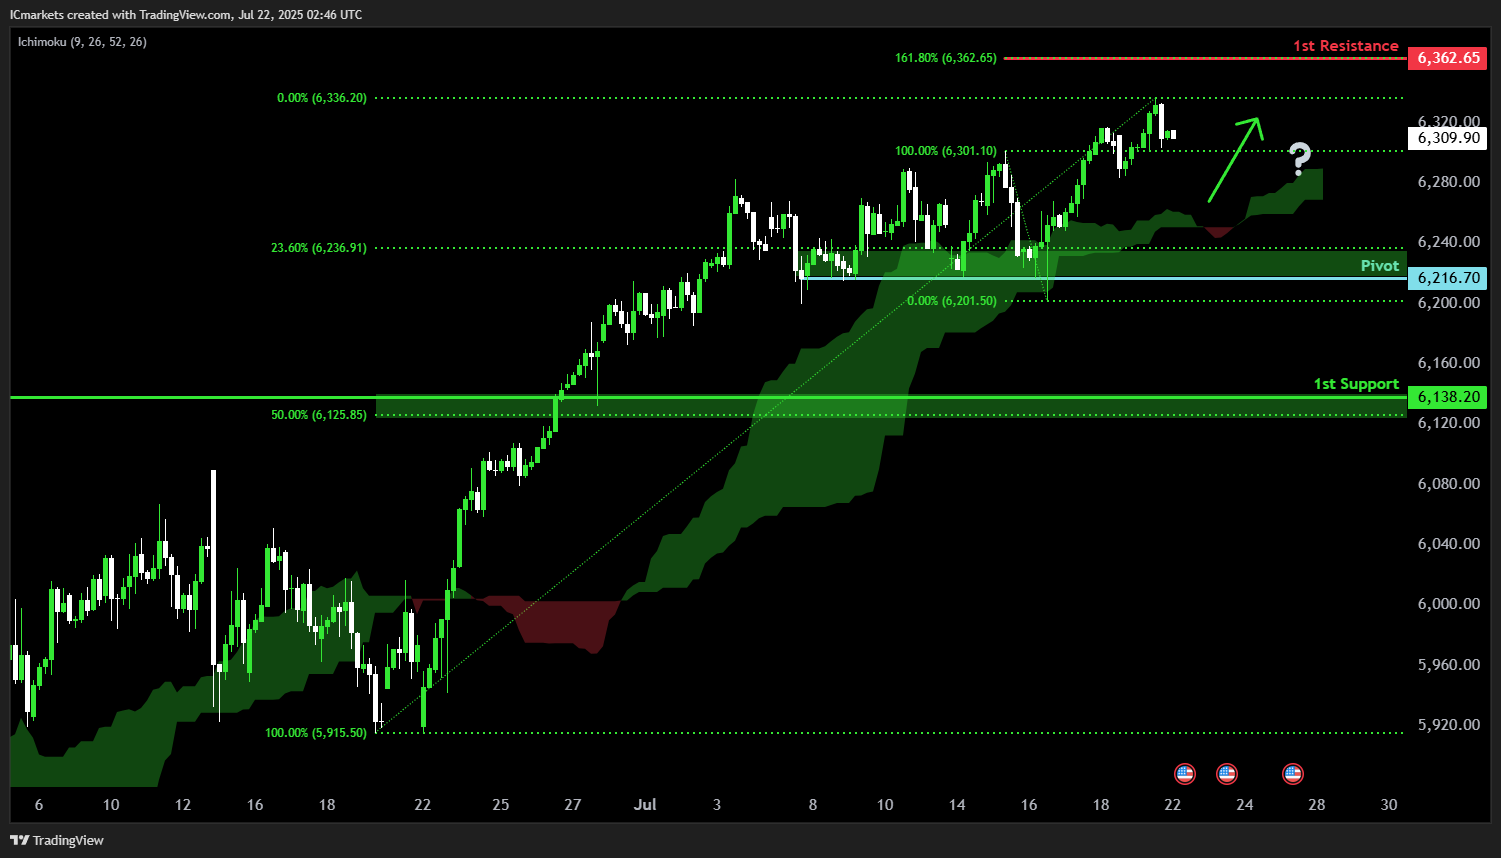
US500 (S&P 500):
Potential Direction: Bullish
Overall momentum of the chart: Bullish
The price could fall toward the pivot and potentially make a bullish bounce off this level to rise toward the 1st resistance. The presence of the green Ichimoku Cloud adds further significance to the strength of the upward momentum.
Pivot: 6,216.70
Supporting reasons: Identified as a multi-swing-low support that aligns closely with a 23.6% Fibonacci retracement, indicating a potential area where buying interests could pick up to resume the uptrend.
1st support: 6,138.20
Supporting reasons: Identified as a pullback support that aligns closely with a 50% Fibonacci retracement, indicating a potential level where the price could stabilize once again.
1st resistance: 6,362.65
Supporting reasons: Identified as a resistance that aligns with a 161.8% Fibonacci extension, indicating a potential area that could halt any further upward movement.
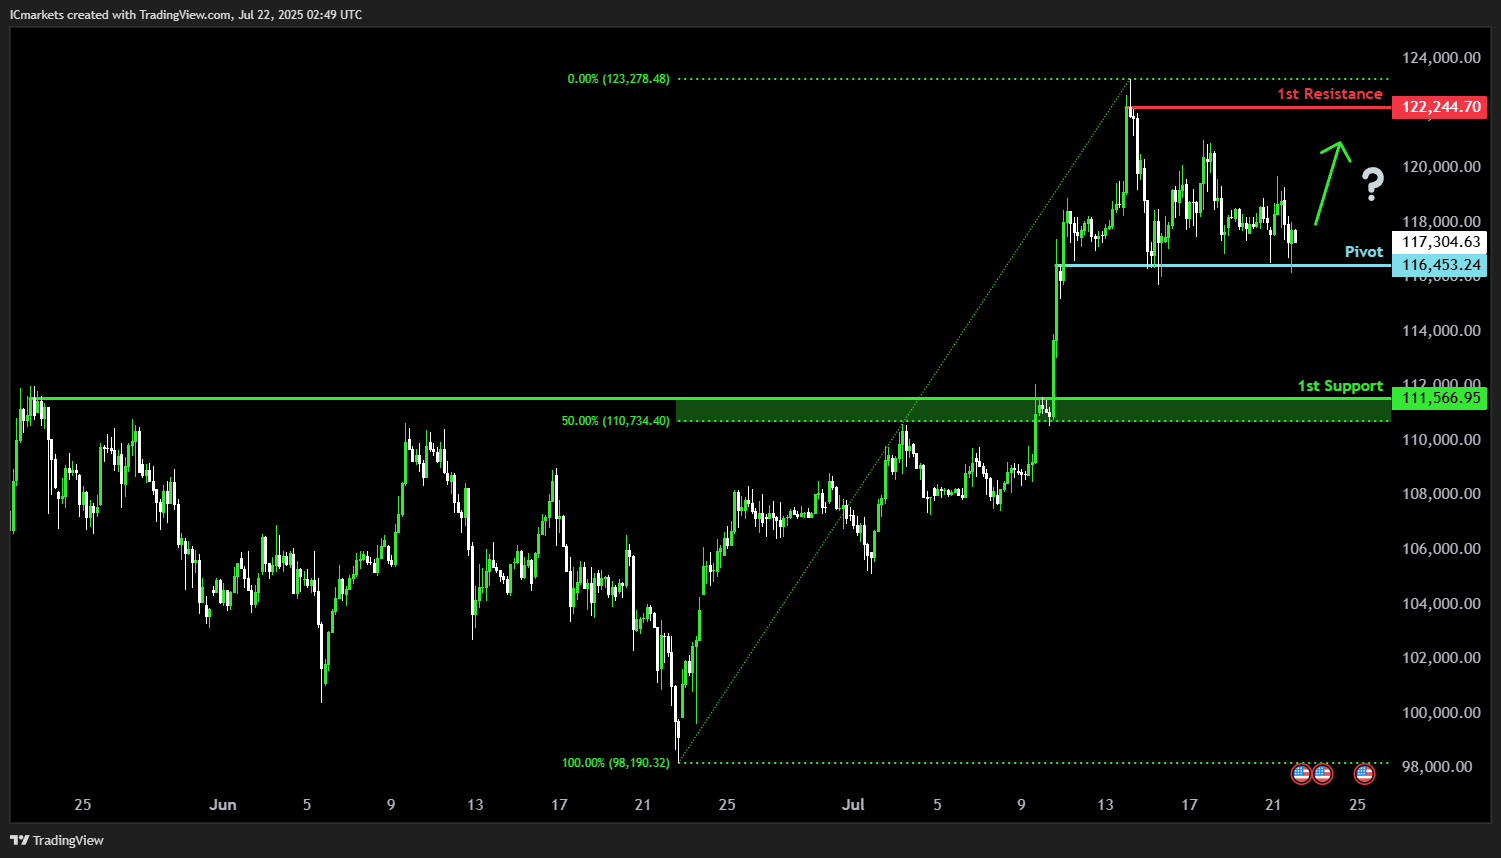
BTC/USD (Bitcoin):
Potential Direction: Bullish
Overall momentum of the chart: Bullish
The price could fall toward the pivot and potentially make a bullish bounce off this level to rise toward the 1st resistance.
Pivot: 116,453.24
Supporting reasons: Identified as a multi-swing-low support, indicating a potential area where buying interests could pick up to resume the uptrend.
1st support: 111,566.95
Supporting reasons: Identified as a pullback support that is closely with a 50% Fibonacci retracement, indicating a potential level where the price could stabilize once more.
1st resistance: 122,244.70
Supporting reasons: Identified as a swing-high resistance, indicating a potential area that could halt any further upward movement.
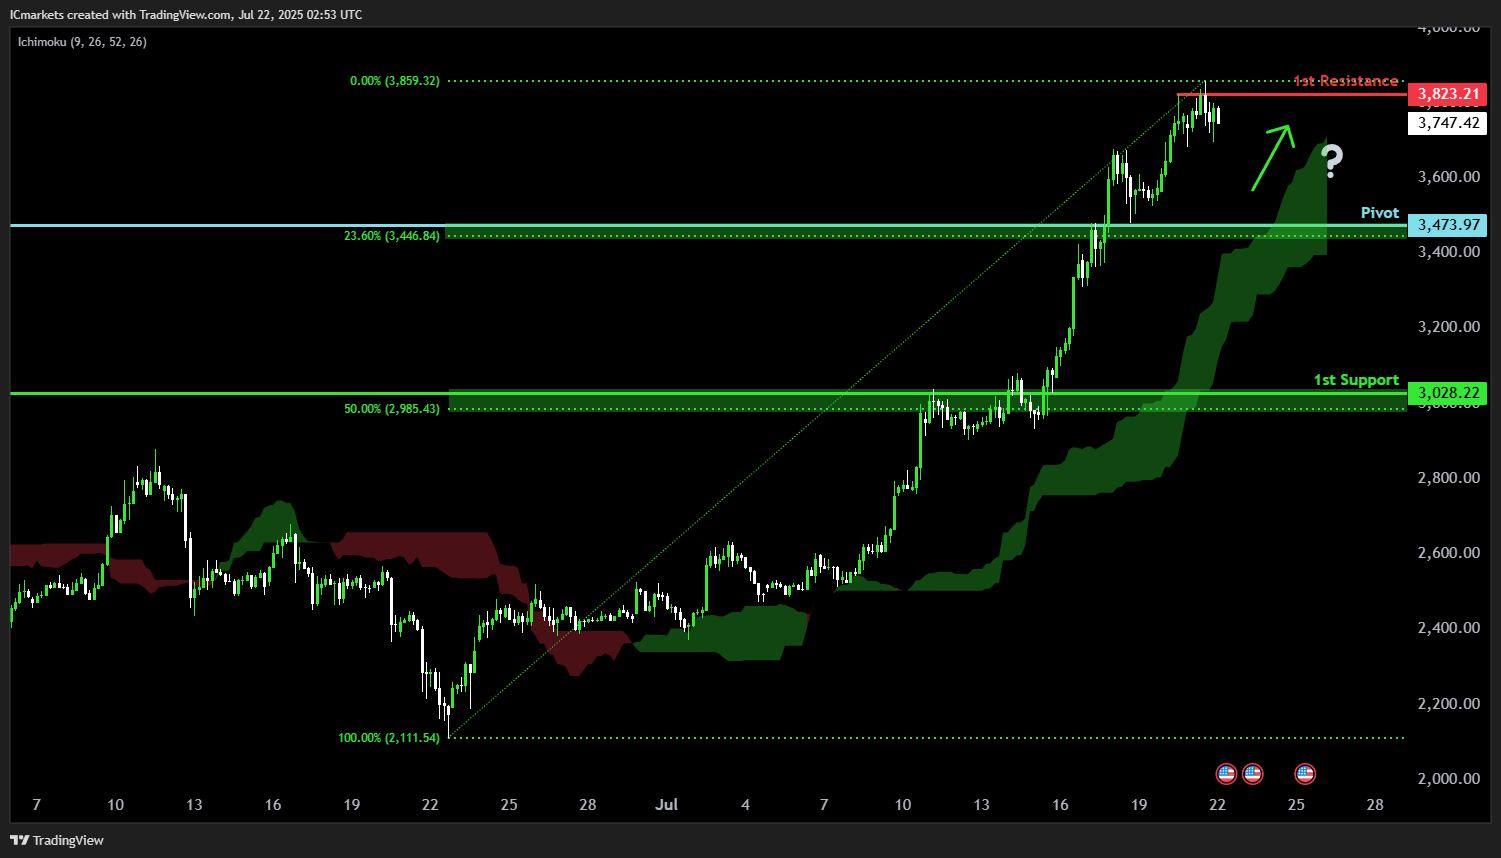
ETH/USD (Ethereum):
Potential Direction: Bullish
Overall momentum of the chart: Bullish
The price could fall toward the pivot and potentially make a bullish bounce off this level to rise toward the 1st resistance. The presence of the green Ichimoku Cloud adds further significance to the strength of the upward momentum.
Pivot: 3,473.97
Supporting reasons: Identified as a pullback support that aligns with a 23.6% Fibonacci retracement, indicating a potential area where buying interest could increase, potentially resuming the uptrend.
1st support: 3,028.22
Supporting reasons: Identified as a pullback support that aligns closely with a 50% Fibonacci retracement, indicating a potential level where the price could stabilize once more.
1st resistance: 3,823.21
Supporting reasons: Identified as a -swing-high resistance, indicating a potential area that could halt any further upward movement.
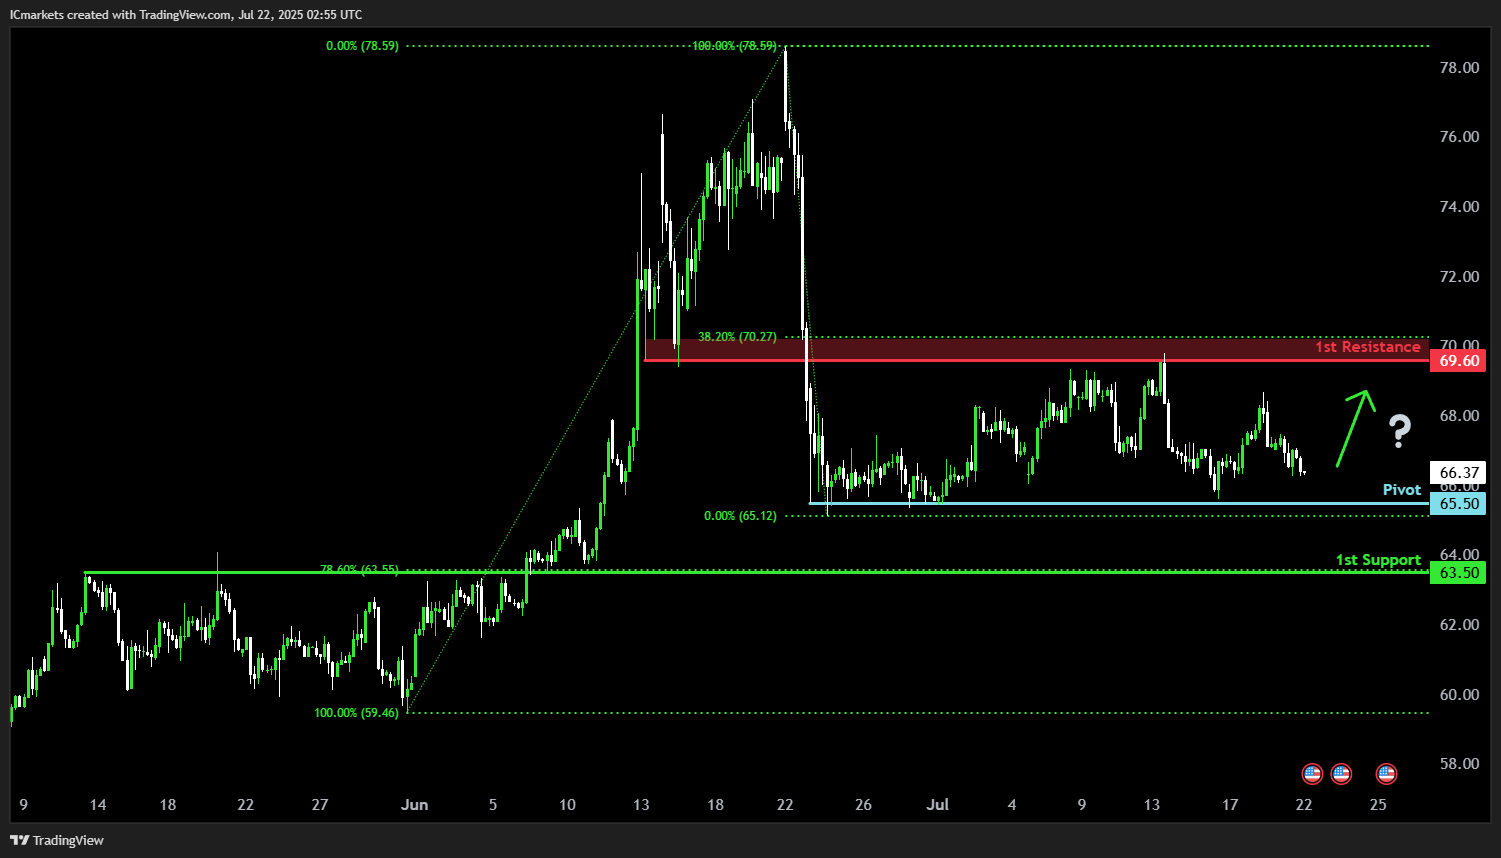
WTI/USD (Oil):
Potential Direction: Bullish
Overall momentum of the chart: Neutral
The price could fall toward the pivot and potentially make a bullish bounce off this level to rise toward the 1st resistance.
Pivot: 65.50
Supporting reasons: Identified as a multi-swing-low support, indicating a potential area where buying interest could increase, potentially staging a rebound.
1st support: 63.50
Supporting reasons: Identified as a pullback support that aligns closely with a 78.6% Fibonacci retracement, indicating a key level where the price could stabilize once more.
1st resistance: 69.60
Supporting reasons: Identified as an overlap resistance that aligns closely with a 38.2% Fibonacci retracement, indicating a potential area that could halt any further upward movement.
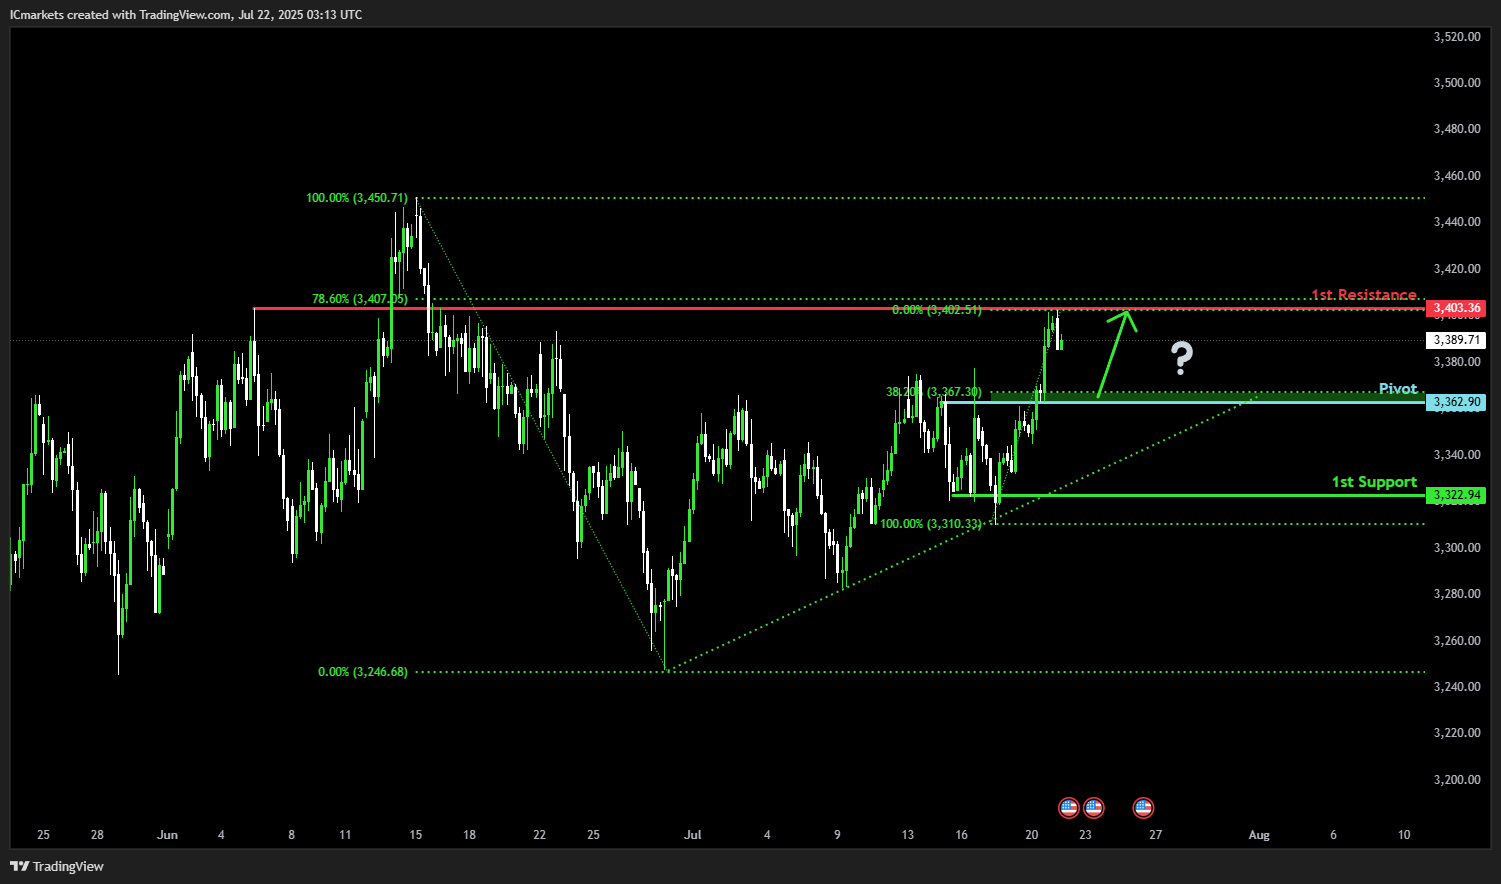
XAU/USD (GOLD):
Potential Direction: Bullish
Overall momentum of the chart: Bullish
The price could make a bullish bounce off the pivot and rise toward the 1st resistance.
Pivot: 3,362.90
Supporting reasons: Identified as a pullback support that aligns with the 38.2% Fibonacci retracement, indicating a potential area where buying interests could pick up to resume the uptrend.
1st support: 3,322.94
Supporting reasons: Identified as a swing low support, indicating a key level where the price could stabilize once more.
1st resistance: 3,403.36
Supporting reasons: Identified as an overlap resistance that aligns with the 78.6% Fibonacci retracement, indicating a potential area that could halt any further upward movement.
The accuracy, completeness and timeliness of the information contained on this site cannot be guaranteed. IC Trading does not warranty, guarantee or make any representations, or assume any liability regarding financial results based on the use of the information in the site.
News, views, opinions, recommendations and other information obtained from sources outside of www.ictrading.com, used in this site are believed to be reliable, but we cannot guarantee their accuracy or completeness. All such information is subject to change at any time without notice. IC Trading assumes no responsibility for the content of any linked site.
The fact that such links may exist does not indicate approval or endorsement of any material contained on any linked site. IC Trading is not liable for any harm caused by the transmission, through accessing the services or information on this site, of a computer virus, or other computer code or programming device that might be used to access, delete, damage, disable, disrupt or otherwise impede in any manner, the operation of the site or of any user’s software, hardware, data or property.